Read the previous article
Load Shedding: useful information
Skip to main content
Skip to menu
Skip to footer

Page Supervision
Ekip Connect
Everything in view, all under control
Select your language
Select your language
Load Shedding: what it looks like
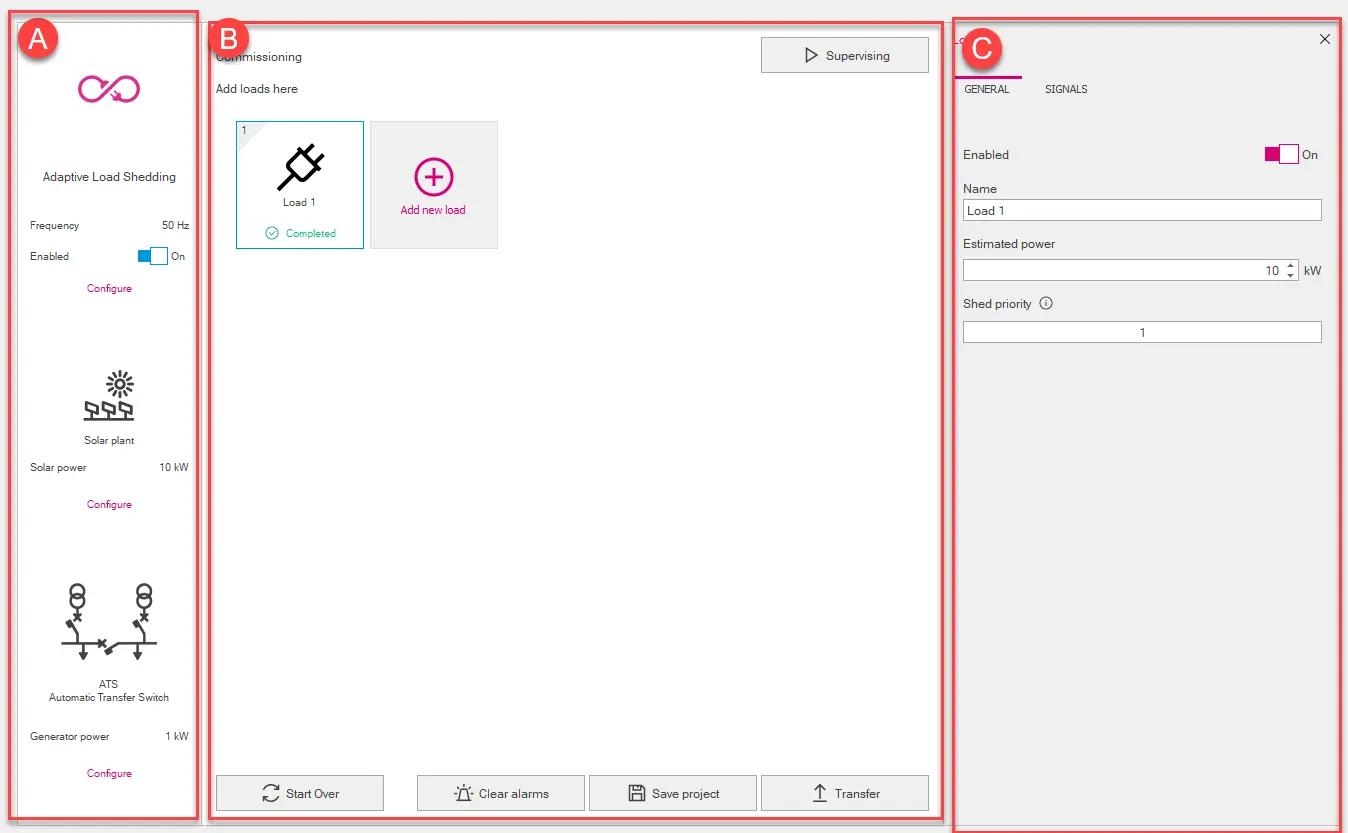
Page Design
Part | Description |
|---|---|
| A | Function Load Shedding area. It contains the following elements:
|
| B | Loads area. It contains the following elements:
Note: the .lds format is a proprietary format that can only be read with Ekip Connect.
|
| C | Area for the parameters of the element selected in [A] or in [B] (Load Shedding: parameters) |
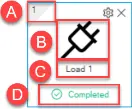
Graphical representation of the load
Part | Description |
|---|---|
| A | Assigned disconnection priority |
| B | Icon selected for the load |
| C | Name assigned to the load |
| D | Load configuration status:
|
 | Button for customising the load icon To display the button, position the mouse pointer over the graphic representation of the load. To display the button, position the mouse pointer over the graphic representation of the load. |
 | Button to delete the load To display the button, position the mouse pointer over the graphic representation of the load. |
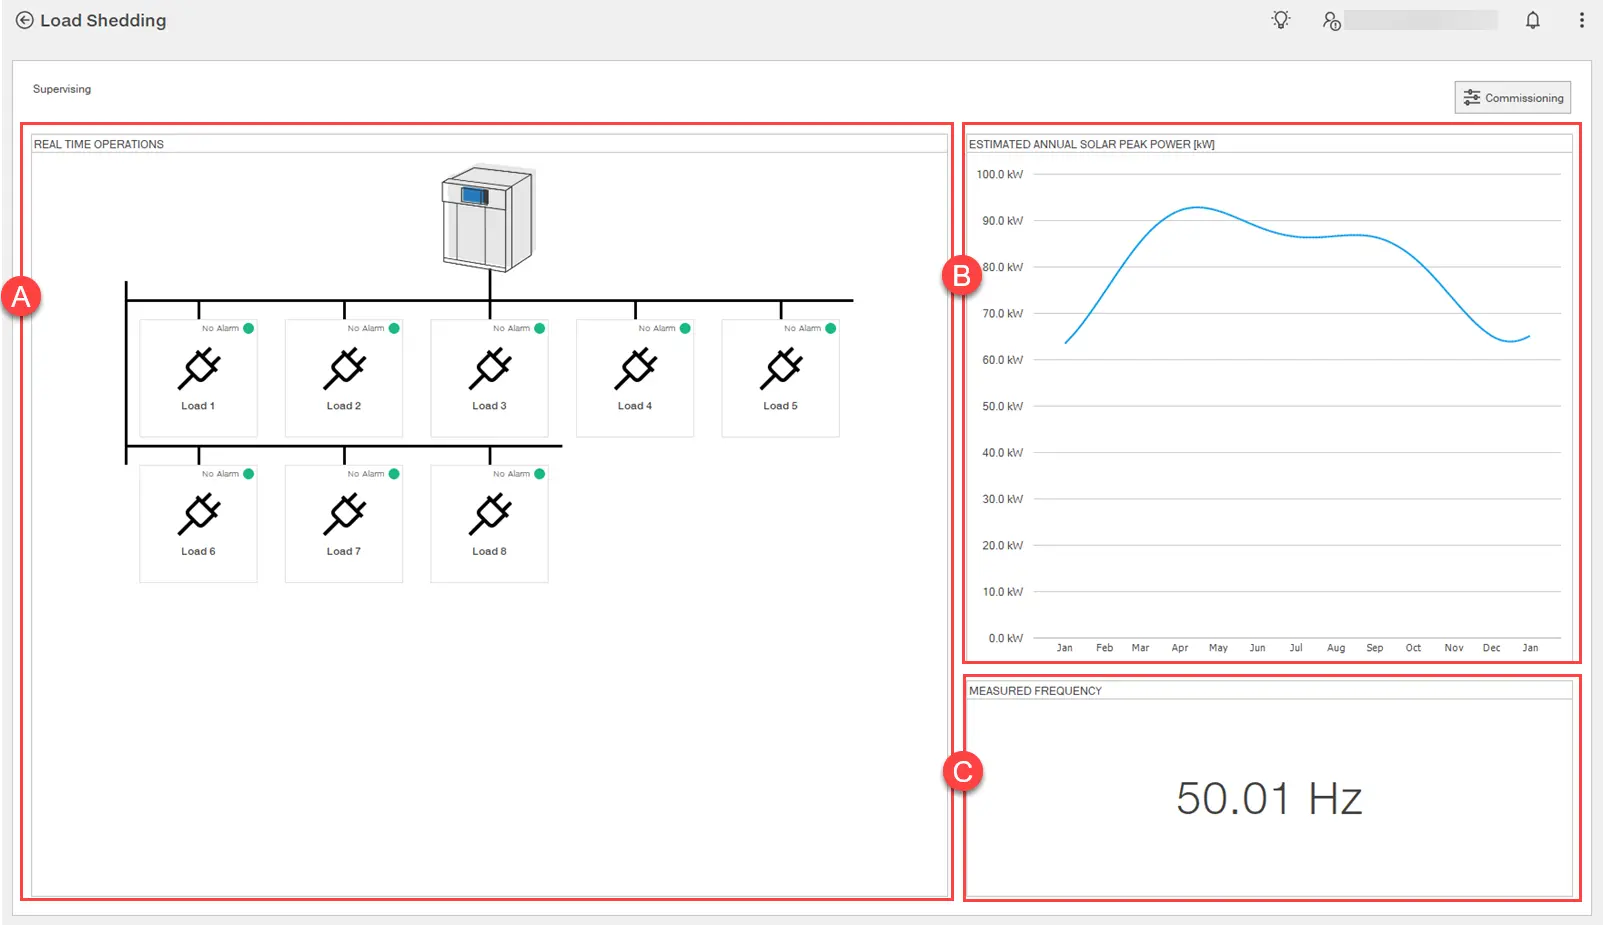
Page Supervision
Note: page only available for Adaptive load shedding.
Part | Description |
|---|---|
| Commissioning | Button to access the Design page (Page Design) |
| A | Load status area.
|
| B | Graph: time (X-axis) and power (Y-axis). Displays the estimated power generated by the photovoltaic system during the year. |
| C | Frequency measured in real time |