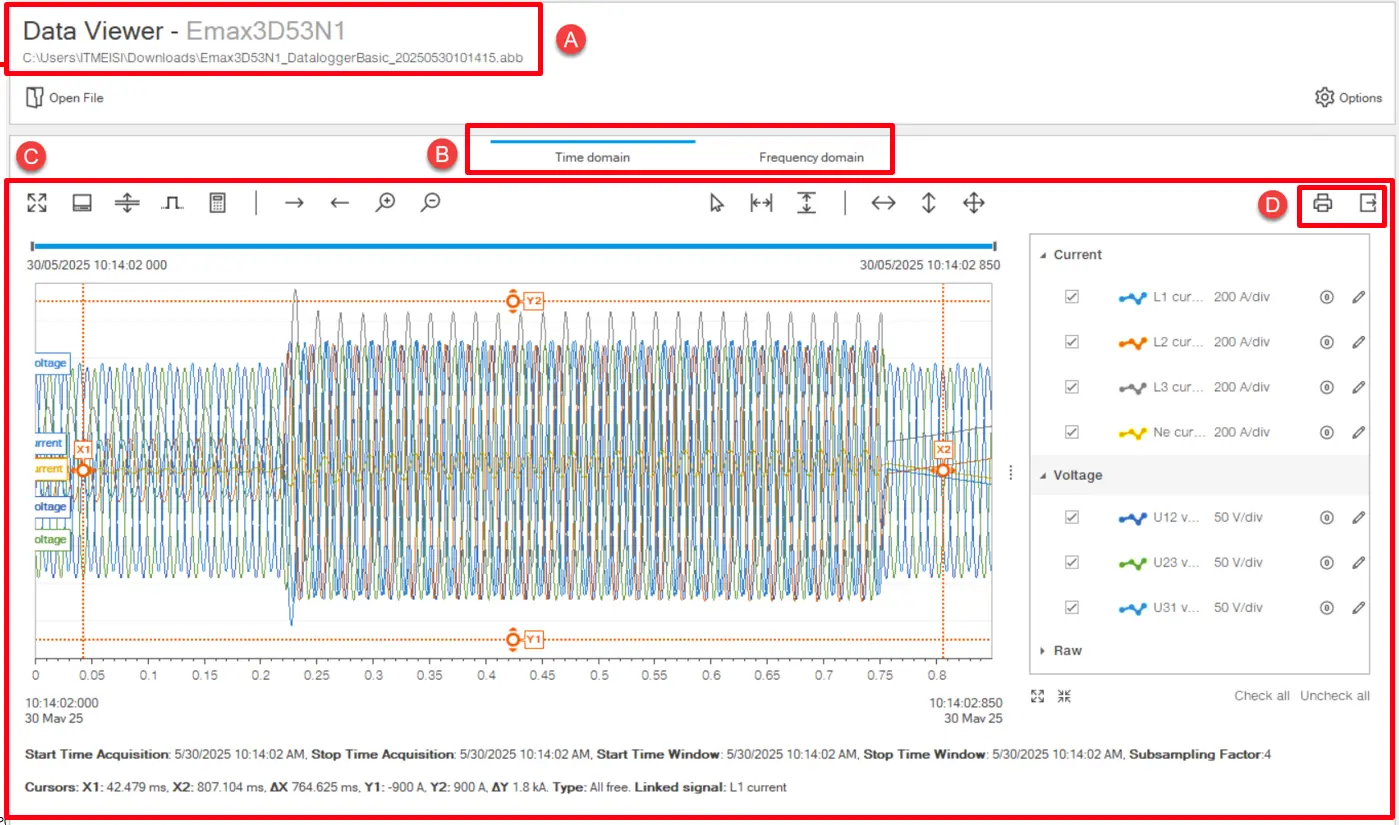
Data display area. The content depends on the type of graph selected in [B].
D
Action buttons:
Print Report: generates the file report with file information, the graph with the currently displayed signals and detailed current and voltage values. The report can be saved in .pdf format or printed.
Export Signals: exports selected current, voltage and digital signals in .csv format.
Time Domain
Part
Description
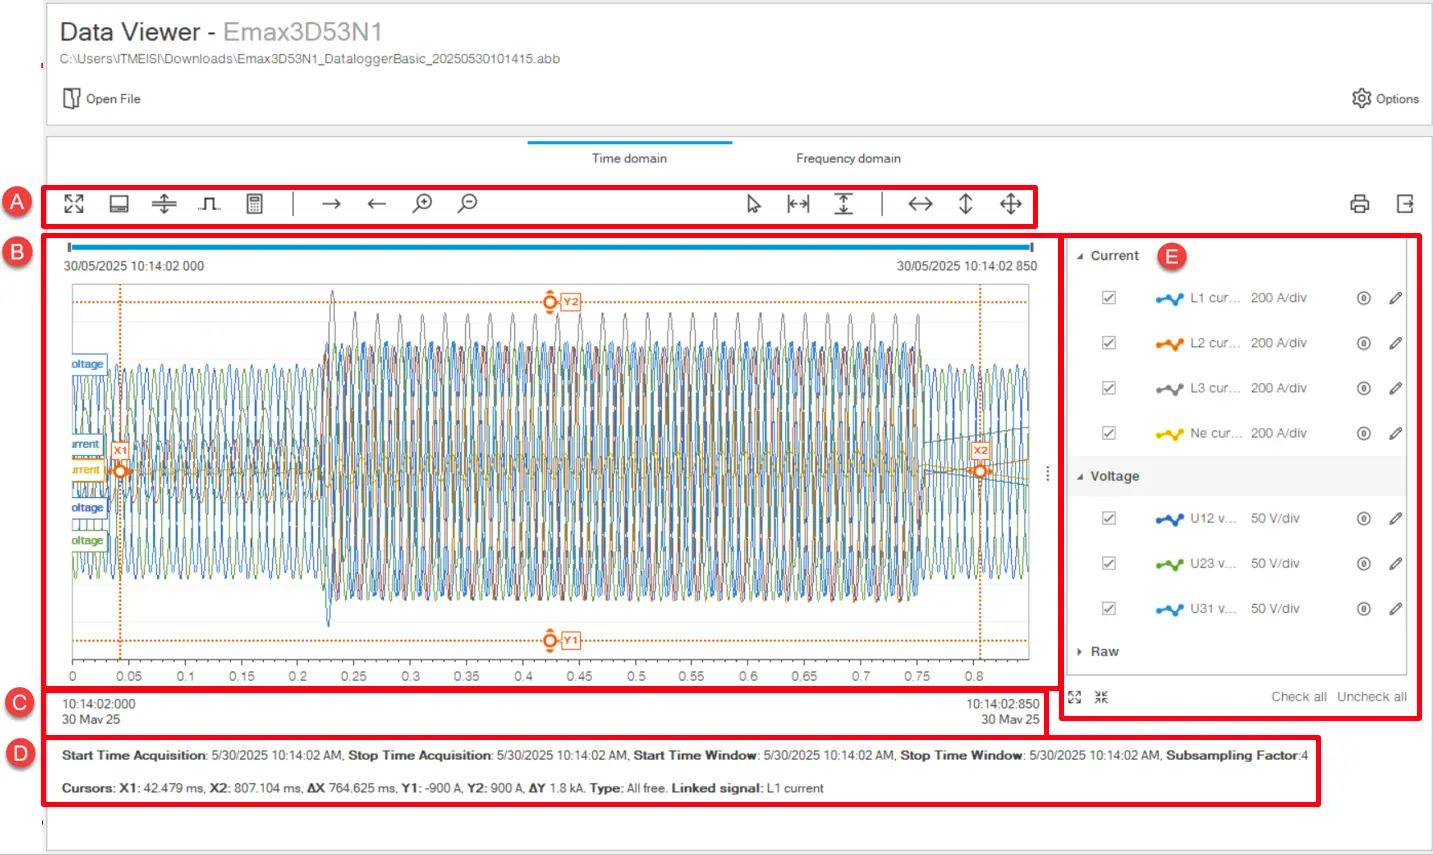
A
Action buttons area in 4 different category;
Signal Window related operations
: expands the graph display area on the page.
Signal info: displays/hides the information of Currents /Voltages at the bottom of window.
Split diagram: separates/merges current and voltage signal graphs.
Show Digital signals: allows you to select which types of digital events to display on the graph.
Edit Signal Expression:
Signal visibility operations
Move right - Move left: Buttons to move selected signal in window.
Zoom in - Zoom out: Buttons to zoom in - out selected signal in window.
Cursor related operations:
Cursors: To customize the cursor setting to be able to set linked signal , track type and delta.
Reset X cursor - Reset Y cursor: Buttons to reset preset cursors.
Axis related operations:
Reset X axis - Reset Y axis: Buttons to reset preset axis respectively in graph.
Reset All axis: Button to reset all preset axis in graph.
B
Graph with voltage and current waveforms recorded over time. If set, it also displays digital event signals.
C
Related real date&time info of recorded file.
D
Dynamically changing information tab related with time window and cursor.
E
Menu to display/hide current, voltage and digital signals in the graph:
: allows you to change how the signal is displayed in the graph
: allows offsets to be reset
Frequency Domain
Part
Description
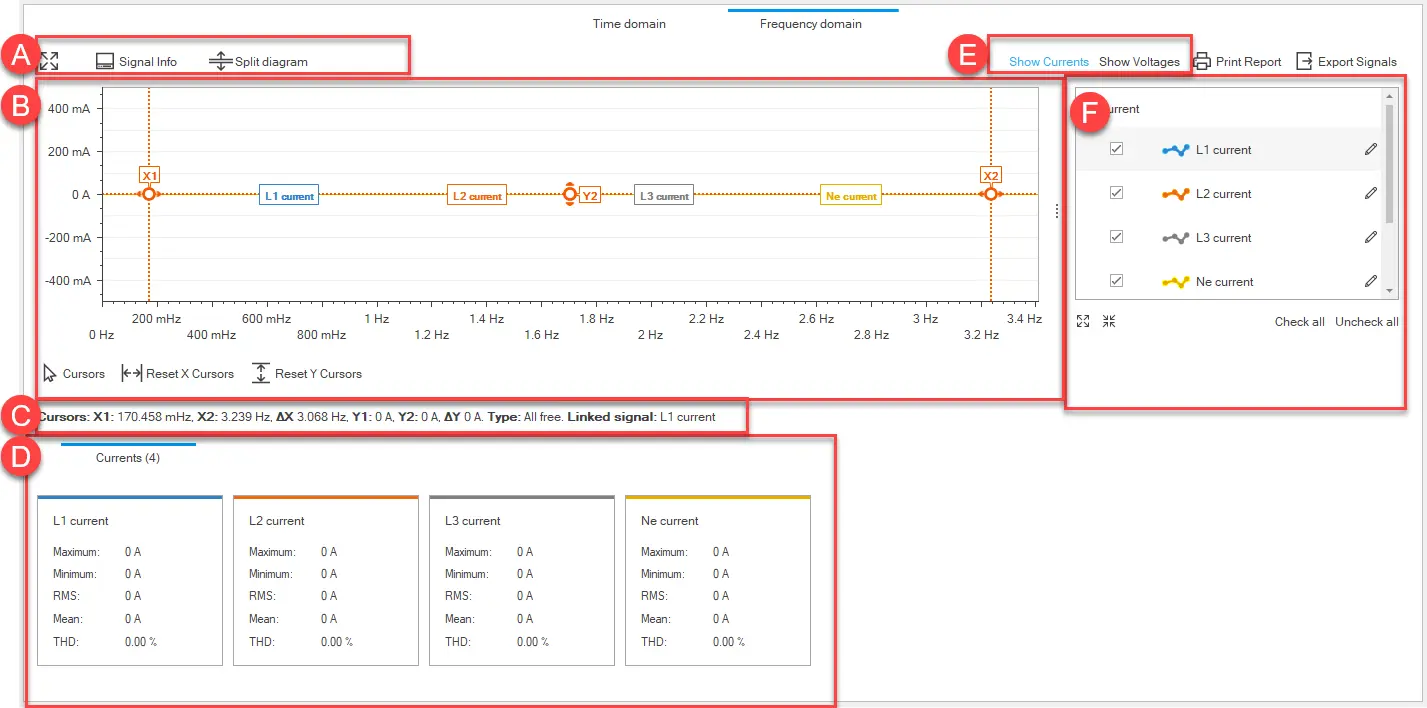
A
Action buttons:
: expands the graph display area on the page.
Signal info: displays/hides the information in [D].
Split diagram: separates/merges current and voltage signal graphs.
B
Graph with the recorded voltage and current harmonic spectrum. It depends on what is selected in [E].
C
Buttons to set the cursor.
D
Detailed values of currents/voltages displayed in the graph.
E
Buttons to display currents or voltages in the graph.
F
Menu to display/hide current/voltage signals in the graph:
: allows you to change how the signal is displayed in the graph
File information
Element
Description
Unit name
Device type
Circuit-breaker tag name
Customized name of the device
Date
Date and time the file was recorded on the device
Sampling frequency
Sampling frequency
Network frequency
Standard frequency of the electrical network
Active test session
True: indicates that the event was recorded during a test session
False: indicates that the event was recorded with the device in operating mode