A Network Analyzer for a circuit breaker is a tool used to monitor and analyze the behavior and performance of a circuit breaker in an electrical distribution system.
It collects information about the quality of the network and the operational parameters of the breaker itself.
In Ekip Connect, with Emax 3 circuit breaker, user may monitor the changes up to 50 events in graphical views. For the other breakers, events can be visualized in Classic view.
In measures page, 2 graphs are available to visualize Voltage magnitude approach and the occurrence of the events. Alternatively, user may verify all events in Classic view → Network Analyzer History.
To visualize the Historical Measures page and both graphs with available data, user must ;
Have Network Analyzer software package from market place
Enable "Network Analyzer Enable" parameter from Classic view.
Tool Overview
The graphs are present in Monitoring → Historical Measures.
Once all prerequisites are fulfilled , user may monitor the graphs with events present in Classic view → Network Analyzer History.
PART
FUNCTION
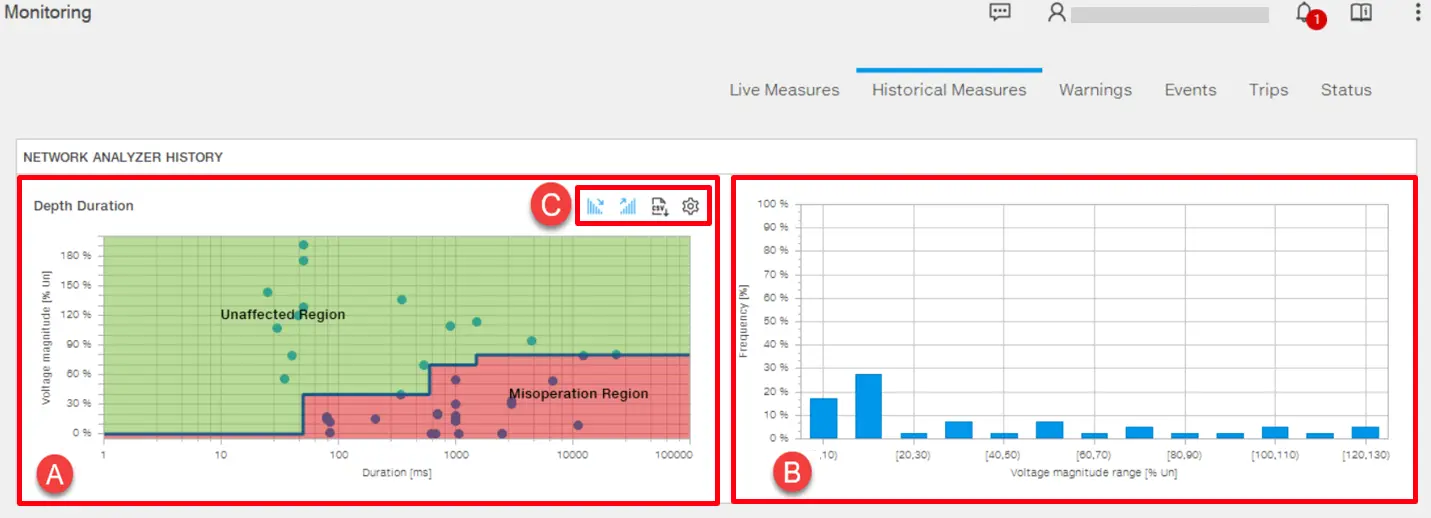
A
Depth Duration : The point graph where user may monitor Sag and Swell events in term of voltage magnitude and duration.
B
Occurrence: The bar graph where user may monitor frequency of happening that specific sag and swell in that voltage magnitude range in terms of frequency and voltage magnitude.
C
Tool tip : Show voltage sags, Show voltage swells, Download data, Settings
Point Graph - Depth duration
In this graph , user may visualize the voltage magnitude with different type of interruption (sag or swell).
User may replot the point graph and download available data by using some tool tips as following;
Show voltage sags: To visualize all available Voltage sags by clicking on from the tool tip.
Show voltage swells: To visualize all available Voltage swells by clicking on from the tool tip.
Download data: To download the data by in .csv format locally.
Settings: To compare the results with respect to voltage standards used for measuring tolerance thresholds.
The available standard curves for the graph are;
ITIC /CBEMA
61000-4-34
Semi f47
User may change the standard curve by selecting from the tool tip . By default "ITIC /CBEMA" is the plotted curve.
For each standard curve there are colour regions ; red and green which serves to show malfunction/interrupt operation area or safe to operate. The values which present in green area have tolerance to without malfunction.
Bar Graph
In this histogram graph, user may visualize the occurrence of that voltage drop for that voltage magnitude range.